Thursday, 7 April 2011

S&P Emini Premium to Cash


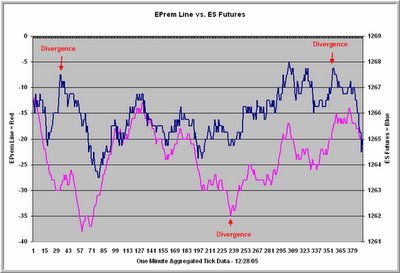
Recently on my site, I mentioned the S&P emini premium to cash as a valuable market indicator reflecting program trading activity. Below is a chart from the 12/28/05 market that tracks the emini premium relative to separate buy program and sell program levels through the day. When the line is rising, it means that there is buying pressure in the ES as gauged by pricing relative to the buy level criteria. A falling line means the reverse. As we can see from the chart above, divergences between the Premium Line (red) and price (blue) are of interest to the short-term trader. I'll post further details on the Weblog.

Selloff In the Last Hour: What Next?

Once you develop a large, deep, and clean intraday database, historical analyses can be conducted on intraday patterns in real time. This allows quantitative traders to track shifting odds through the trading day. For example, you can look at what typically happens after the market opens up, but then retraces this rise in the first 15 minutes of trading. Or you could look at a day like Friday and ask, "What typically happens after the market sells off in the last hour and makes a new low for the day?"

It turns out that this has occurred 14 times in the past 250 trading sessions (which goes back to late December, 2004). After this selloff, the market (ES futures) has opened up the next day 6 times, opened down 6 times, and opened unchanged twice for an average gain of .07%. No real edge there.

By the end of the first hour of the next day of trading, however, the market has been up 11 times, down twice, and unchanged once for an average gain of .17%. This compares favorably to the average gain of .07% (141 up, 106 down, 3 unchanged) for the first hour of trade across the entire sample.

This bullish bias in the first hour of trade after a selloff dissipates through the remainder of the trading day (i.e., there is no edge holding on beyond that first hour).

In short, late selloffs have tended to be at least partially reversed during the first hour of trade the next day.

Once you start thinking of the morning, midday, and afternoon market hours as separate trading sessions, lots of intraday analyses become possible. A few are even meaningful... :-)
Inside Day After A Fall

Wednesday traded much more like a holiday session than Tuesday, remaining in a narrow range. After Tuesday's decline, Wednesday gave us an inside day. So, I decided to take a look at what happens after inside days that follow weakness vs. strength.

Since January, 2003 (N = 752), we've had 100 inside days. In general, returns following inside days are nothing to write home about. Two days later, the market (SPY) averages no change (47 up, 53 down), compared with a gain of .09% (402 up, 350 down) for the sample overall.

When the inside day follows strength (an up day; N = 50), the next two days in SPY average a loss of -.11% (23 up, 27 down). When the inside day follows weakness (a down day; N = 50), the next two days in SPY average a gain of .12% (24 up, 26 down). Interestingly, when the inside day follows a very weak session (down by more than 1%; N = 17), such as the present situation, the next two days average a gain of .40% (9 up, 8 down).

In general, inside days following strength tend to be weaker than inside days following weakness, but there are no decisive edges in the data. It's a bit like poker: knowing when you have a hand that gives you no real odds is not exciting, but--to a pro--it's information. In time you'll draw the nuts; mucking your hand when you have nothing helps you keep your winnings. Today we've drawn 4, 8 unsuited.

Up Open, Down Day

Tuesday's market (SPY) opened up, but then closed down over 1% on the day. Since January, 2003 (N = 750), we've had 80 days in which SPY has fallen by 1% or more. The next day, the market is up on average by .24% (50 up, 30 down), which is stronger than the average gain of .05% (415 up, 335 down).

Interestingly, however, when the down day in SPY started the day by opening to the upside (N = 23), the average change the next day is -.02% (13 up, 10 down). When the down day opened down and stayed weak (N = 57), the average next day change is .35% (37 up, 20 down). It thus appears that days that start strong (such as Tuesday), but become weak are more likely to show followthrough weakness the next day that markets that are weak throughout the day. One way of looking at this is that markets opening up are trapping the buyers, while markets that open down trap the sellers the following day.

Dow Industrials and Utilities

While traders marvel over the performance of GOOG and AAPL, the Dow Utilities have quietly doubled in value over the past three years--not bad for a collection of stocks once thought for widows and orphans. Accordingly, I thought it would be interesting to see how the Dow Utilities fared as a predictor of the Industrials.

Over the past seven trading sessions, the Industrials have been essentially unchanged, but the Utilities have declined by about 1.2%. Going back to January, 2003 (N = 745), I decided to look at flat periods when the Industrials were up or down within .30% over a seven-day period (N = 93). Seven days later, the Industrials averaged a loss of -.30% (44 up, 49 down), worse than the average seven-day change for the entire period (.23%; 412 up, 333 down).

A median split based upon the Utilities, however, reveals a pattern. When the Utilities have been strong while the Industrials have been flat over a seven-day period(N = 47), the Industrials have lost an average -.60% (20 up, 27 down) over the next seven sessions. When the Utilities have been weak during flat seven-day periods in the Industrials, the next seven days in the Industrials have averaged .02% (24 up, 22 down).

In short, when the Industrials have showed relative strength compared to the Utilities on a seven-day basis (as they have recently), they have performed better over the next seven days than if they show relative weakness. While there is no upside edge in the pattern at present, neither is there a significant downside one.